Man has recorded his mood every 15 minutes for 7 years. Here's what he learned about happiness.
"The search for that formula is what keeps me going."

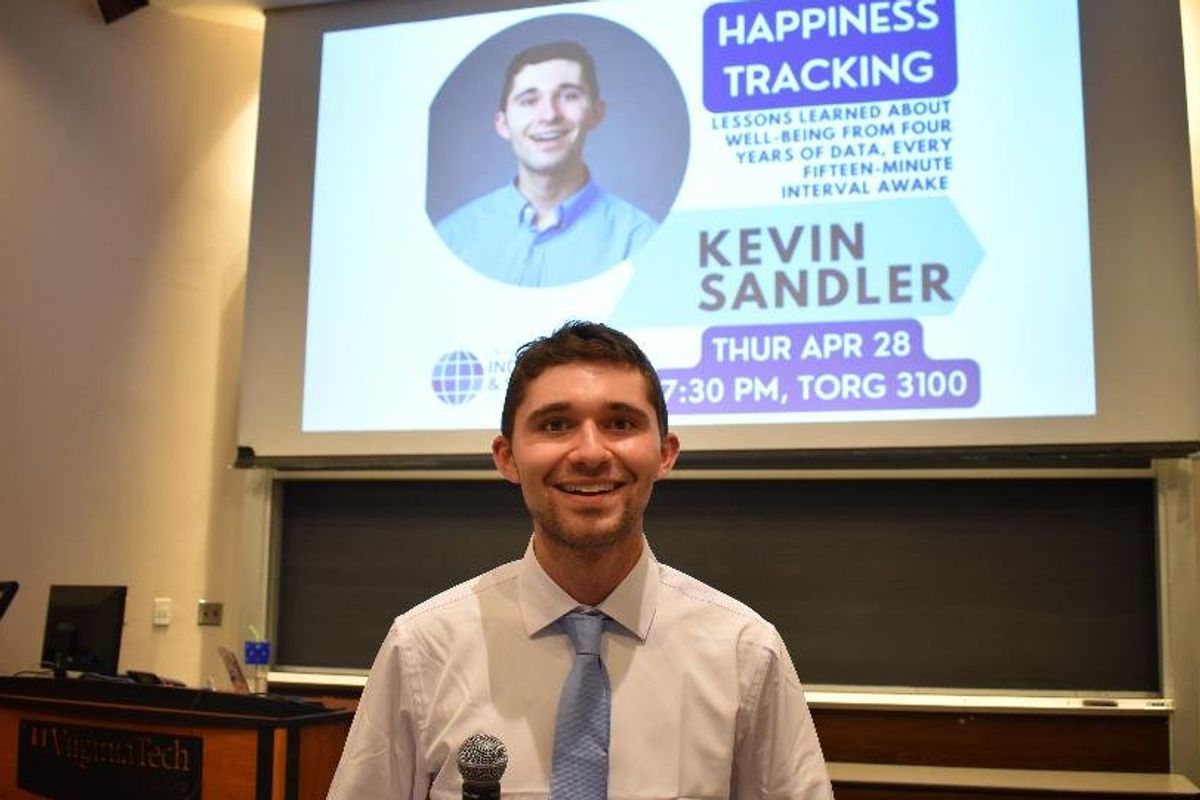
Kevin Sandler discusses his mood tracking.
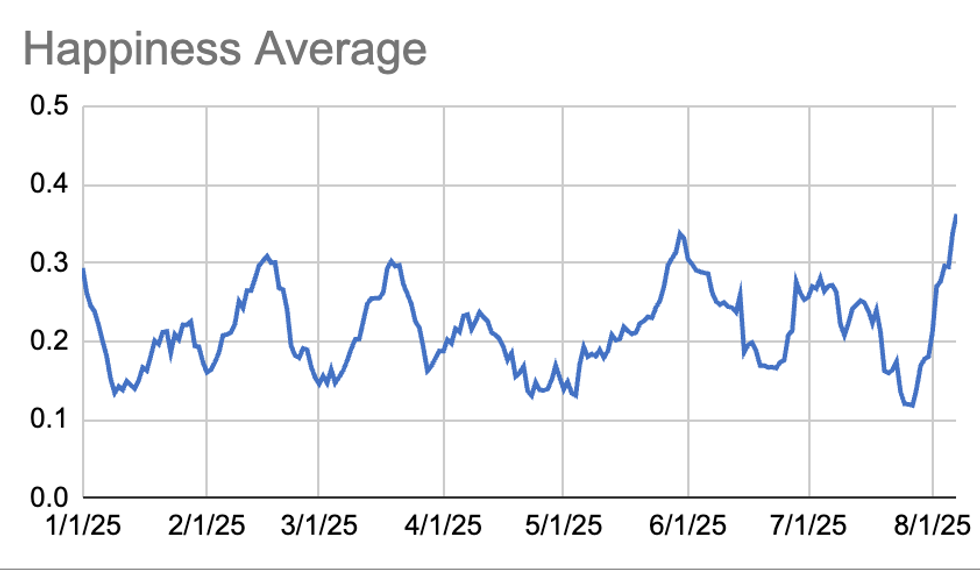
Kevin Sandler woke up one day in 2018, a senior in high school, and decided to do something unusual. A self-described "data nerd," he wanted to find a way to make a quantitative roadmap to understanding what, exactly, made him happy. So, he began charting his moods every fifteen minutes and has done so for the past seven years.
He's not the first to track moods. The popular logging journal app, A Year in Pixels, helps people assess their emotions using color grids that people can individually design. One can then see their moods change with charts based on weeks, months, and years allowing them to visualize how their overall well-being tracks through time.
In fact, Sandler was inspired by this app, but wanted more. He didn't just want the "what" or "when" of it all. He wanted the "why." In an exclusive chat with Upworthy, he jokes, "I thought, how can I make this even MORE intense?"
His goal? "I just wanted to visualize my life, in terms of happiness. I wanted to see my happiness charted in a graph. From there, it took on a life of its own."
At first, he started tracking his mood three times per day, but thought, "My mood changes too much." He then did it hourly, finally landing on 15-minute intervals of waking hours. (We did confirm that he doesn't wake himself up in the night to measure his moods.)
In her opinion piece "Are We Happy Yet?" for The New York Times, author Jessica Grose spoke to Sandler, who admitted that "when you're in the moment, you don't have a full perception of how you actually feel." This is why, she explains, he "tracks his location using Google Maps and then the following day creates a kind of emotional map." This gives him a bit of perspective, which ultimately provides stronger pattern recognition.

Sandler also discovered that "happiness" wasn't exactly the end goal. Instead, it's being content or "satisfied with your life overall." Another distinction Sandler makes very clear is that what he's searching for is a formula for his happiness, fully acknowledging that it's different for everyone. He also notes that he's specifically looking for actionable data—things he can actually do to put his findings into positive action. "There's a lot of information out there on what makes you happy. So like, sunlight or close connections. But what action can I take today? And what is the measurable impact? The search for that formula is what keeps me going."
@sndcastle Tracking my happiness in fifteen minute intervals - Scotland Day 3
He recognizes that there are a lot of theories, philosophies, and studies committed to what makes people happy. "Is being around other people still the biggest influence? Absolutely. Nothing new that the secret to happiness is connection. But now that we have that knowledge, how can we get practical? How many hours should you spend around other people? What quality of people do I need to be around?"
When asked what seems to work for his personal happiness, besides the aforementioned sunlight and human connection, he shares that the quality of the people you spend your day around is a huge factor. But also, "how motivated you feel about what you're working on that day."
He also mentions the importance of personal values. "I value distinctiveness and novelty. So, I like to make each day have its own distinctiveness from the last. I want to figure out that formula for myself, that can inspire other people to find their own formula."

Another discovery is the unique magnificence of being able to look at how far he's come. "I started when I was 17. It's crazy how different your emotional variability changes from a teenager into adulthood. And the fact that I got to track my happiness through that transition is remarkable. Because the highs and lows that I used to go through. I have quantitative data to show how different it is!"


 The pay is good and you get to drive this sweet truck around!Photo by
  Three USPS boxes. via

 Philip painted this blue mountain lake piece with help from a YouTube tutorial. bruncvik/reddit
  Here's what the painting was "supposed" to look like. She'z ART/YouTube
  I love this haunting purple and orange piece Philip painted! bruncvik/reddit
  A YouTube tutorial of a sunset river helped Philip learn to paint the scene. She'z ART/YouTube
 Traditional strawberry farming takes up a lot of land.
 Strawberries are a wildly popular fruit.