ER doctor in Canada writes ‘climate change’ on patient’s chart in an unprecedented diagnosis
As record-breaking heat and out-of-control wildfires raged in the beautiful Canadian province of British Columbia this past summer, people started arriving to the emergency room of Kootenay Lake Hospital with symptoms of heat illness. Dr. Kyle Merritt, the head of the emergency department, told the Times Colonist that most of the doctors at the hospital…
Photo credit: Photo by kerry rawlinson on Unsplash – Climate change is causing record-breaking heat and intense wildfire seasons, worsening health issues.
As record-breaking heat and out-of-control wildfires raged in the beautiful Canadian province of British Columbia this past summer, people started arriving to the emergency room of Kootenay Lake Hospital with symptoms of heat illness.
Dr. Kyle Merritt, the head of the emergency department, told the Times Colonist that most of the doctors at the hospital had only seen such heat illness in medical school. Now they found themselves with a flood of it as the temperatures rose.
“We were having to figure out how do we cool someone in the emergency department,” said Merritt. “People are running out to the Dollar Store to buy spray bottles.”
A patient arrived who was struggling to breathe. The smoke from the wildfires in the area hadn’t lifted for days, and the patient’s asthma was being aggravated by it.
Merritt took the patient’s chart and wrote two words he’d never written on a chart before: “climate change.”
When asked why he did it, Merritt said, “If we’re not looking at the underlying cause, and we’re just treating the symptoms, we’re just gonna keep falling further and further behind.”
“It’s me trying to just…process what I’m seeing,” he said. “We’re in the emergency department, we look after everybody, from the most privileged to the most vulnerable, from cradle to grave, we see everybody. And it’s hard to see people, especially the most vulnerable people in our society, being affected. It’s frustrating.”
Merritt said a woman in her 70s who lived in a trailer with no air-conditioning had come into the ER. She was struggling to stay hydrated, and the heat was exacerbating her other health conditions, including diabetes and some heart failure. Patients like her, with multiple health problems and little money, will be the most affected by the climate crisis.
However, we’re all seeing that there’s no escaping its impact. Hundreds died during this summer’s heat dome in western Canada and the northwestern United States. An entire Canadian village was wiped out by wildfire as temperatures reached a record 121 degrees this summer. We’ve been told for years that climate change would result in more extreme weather events, and here we are.
Merritt said he hoped seeing “climate change” on the patient’s chart would prompt other doctors who see it one day to make the connection between their patients’ health and climate change.
Extreme weather affects more than people’s physical health. Merritt says he saw a number of patients already suffering from depression or anxiety have their symptoms worsen during the wildfire season. Wildfire smoke even triggered flashbacks in a patient who was coping with post-traumatic stress disorder from his time as a soldier.
The World Health Organization calls climate change “the single biggest health threat facing humanity” and health professionals worldwide are responding. Doctors and nurses in western Canada held a climate rally at the B.C. Legislature organized by Doctors for Planetary Health—West Coast on November 4. The healthcare workers are calling on lawmakers to act in the face of the growing ecological threat to health and demanding that the provincial government declare a climate and ecological emergency.
Writing “climate change” on a patient’s chart may be unprecedented, but so are the times in which we live. If we are going to keep breaking records each year and keep seeing health-affecting extremes in temperature and weather events, we’re going to have to do unprecedented things. Doctors and nurses are on the front lines, seeing those health impacts firsthand.
An Operation Smile volunteer reverses an oxygen mask so a child with a cleft condition can blow a bubble for the first time in Guadalajara, Mexico. (Operation Smile Photos)
For thousands of children born with cleft conditions, Operation Smile provides simple, playful tools—like bubbles—to strengthen the skills they need to speak and thrive.
While a bottle of bubbles might seem out of place in a hospital setting, you might be surprised to learn that, for thousands of children around the world born with cleft lip and palate, they can be a helpful tool in comprehensive cleft care. Lilia, who was born with cleft lip and palate in 2020, is one of the many patients who received this care.
As a toddler, Lilia underwent two surgeries to treat cleft lip and palate with Operation Smile’s surgical program in Puebla, Mexico. Because of Operation Smile’s comprehensive care, it wasn’t long before her personality transformed: Lilia went from a quiet and withdrawn toddler to an exuberant, curious explorer, babbling, expressing herself with a variety of sounds, and engaging with others like any child her age.
Lilia is now a healthy five-year-old, with the same cheerful attitude and boundless energy. Her progress is the result of care at every level, from surgery to speech therapy to ongoing support at home—but it’s also evidence that small, sustained interventions throughout it all can make a meaningful difference.
Lilia at age 1, before surgery, and at age 5, 4 years post-surgery
Cleft Conditions: A Global Problem
Since 1982, Operation Smile has provided cleft lip and cleft palate surgeries to more than 500,000 patients worldwide with the help of generous volunteers and donors. Cleft conditions are congenital conditions, meaning they are present at birth. With cleft lip and palate, the lip or the roof of the mouth do not form fully during fetal development. Cleft conditions put children at risk for malnutrition and poor weight gain, since their facial structure can make feeding challenging. But cleft conditions can have an enormous social impact as well: Common difficulties with speech can leave kids socially isolated and unable to meet the same developmental milestones as their peers.
Surgery is a vital step in treating cleft conditions, but it’s also just one part of a much larger solution. Organizations like Operation Smile emphasize the importance of multi-disciplinary teams that provide comprehensive, long-term care to patients across many years. This approach, which includes oral care, speech therapy, nutritional support, and psychosocial care, not only aids in physical recovery from surgery but also helps children develop the skills and confidence to eat easily, speak clearly, and engage in everyday life. This ensures that each patient receives the full range of support they need to thrive.
Marie, 11 months, with her mother at Operation Smile Madagascar before her cleft surgery (Operation Smile Photos)
A Playful (and Powerful) Solution
Throughout a patient’s care, simple tools like bubbles can play a meaningful role from start to finish.
Immediately before surgery, children are often in a new and unfamiliar environment far from home, some of them experiencing a hospital setting for the first time. When care providers or loved ones blow bubbles, it’s a simple yet effective technique: Not only are the children soothed and distracted, the bubbles also help create a sense of joy and playfulness that eases their anxiety.
Milagros Rojas, a volunteer speech therapist in Peru, using bubbles in a screening with a patient. (Operation Smile Photos)
In speech therapy, bubbles can take on an even more important role. Blowing bubbles requires controlled airflow, as well as the ability to form a rounded “O” shape with the lips, which are skills that children with cleft conditions may struggle to develop. Practicing these skills with bubbles allows children to gently strengthen their facial muscles, improve breath control, and support the motor skills needed for speech development. Beyond that, blowing bubbles can help kids connect with their parents or providers in a way that’s playful, comforting, and accessible even for very young patients.
Finally, bubbles often follow patients with cleft conditions home in the “smile bags” that each patient receives when the surgical procedure is finished. Smile bags, which help continue speech therapy outside of the hospital setting, can contain language enrichment booklets, a mirror, oxygen tubing, and bubbles. While regular practice with motor skills can help with physical recovery, small acts of play help as well, giving kids space to simply enjoy themselves and join in on what peers are able to do.
Bubbles at Home and Beyond
Today, because of Operation Smile’s dedication to comprehensive cleft care, Lilia is now able to make friends and speak clearly, all things that could have been difficult or impossible before. Instead of a childhood defined by limitation, Lilia—and others around the world—can look forward to a childhood filled with joy, learning, discovery, friends, and new possibilities.
CTA: Lilia’s life was changed for the better with the care she received through Operation Smile. Find out how you can make an impact in other children’s lives by visiting operationsmile.org today.
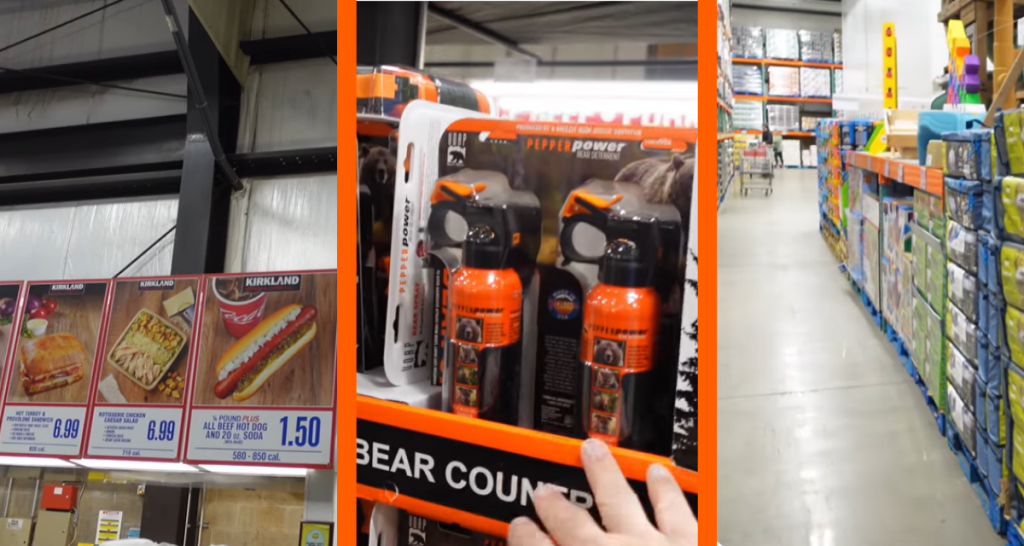
Costco is beloved by its loyal customers around the world. There are more than 800 locations worldwide, according to Costco.
The world’s smallest Costco warehouse is located all the way in Juneau, Alaska. The Juneau Warehouse was opened on November 4. 1993.
YouTuber Adam Legg (@LeggLife), a creator from Anchorage, Alaska, gave a full-fledged tour of the big box store dubbed a “tiny but legendary Costco location.”
“I think it is also one of the most beautiful settings of any Costco,” says Legg in the video, as he later shows the building’s backdrop that features an evergreen forest, fog, and snow-covered mountains. “This is a unique one. It is roughly half the size of a normal Costco.”
Despite its size, the world’s smallest Costco is still impressively stocked.
“It carries more than half the amount of products. So most ‘normal’ Costco’s carry right around 3,800-4,000 products,” says Legg. “This Costco carries about 3,200. So even though it is half the size, it carries more than half the amount of products.”
When it comes to prices, Legg explains that “everything in Juneau comes in either by ship or by plane. There are no roads to Juneau, Alaska.”
As he walks in, there is the familiar electronics section with TVs and more, including some massive inflatable water toys for the yard that Legg did not expect.
Things in our Alaska Costco that would confuse people from the lower 48 😭❄️🛒 🌙 blackout curtains because the summer sun literally does not go down in parts of Alaska 🥾 hiking sticks because “going for a walk” here can accidentally turn into a mountain hike 🎣 fishing waders because salmon fishing is basically a personality trait in Alaska 🦟 mosquito spray because Alaska mosquitoes are genuinely terrifying in the summer 🏕️ camping gear (SEASONAL) because half the state disappears into the wilderness every weekend this time of year 🛶 paddle boards and kayaks immediately hit the shelves the second breakup season starts 👢 Xtratuf boots because they’re basically the official state shoe 🔥 fire extinguishers near the entrance once wildfire season starts 🐻 bear spray sold casually like it’s sunscreen bcs we are is bear country and we all own a least a can or two! Living in Alaska means one Costco trip can prepare you for fishing, hiking, camping, wildfire season, and a bear encounter all in the same afternoon 😂 Where are you watching from? Which one surprised you the most? #fairbanks#alaska#livinginalaska#lifeinalaska#fyp @Costco Wholesale
Immediately, Legg notices some items ‘unique’ to the Juneau location. These include some XTRATUF rain boots that Legg himself is wearing to the store, a necessary staple for Alaska’s climate. There’s also some University of Alaska-Fairbanks clothing. Legg notes that the clothing section is “smaller than most Costcos.”
There are also home goods items, furniture, and mattresses. Legg then shows some other “interesting” regional necessities: bear spray and mosquito/tick repellant.
Legg explains that there are also many summer Alaska essentials, like backpacks, coolers, and “giant family tents and canopies.”
Food items
Legg makes his way to the grocery section. He points out that a large watermelon is $12.99, and bananas are $2.99 a pound. Moving on to the prepared meat, the baby back ribs are $7.99 a pound, and chicken wings are also available.
However, one iconic Costco item is not available at the location: the rotisserie chicken.
“The rotisserie chickens was one of the things I was wondering about, but they don’t have them,” Legg says.
There are still many meat and seafood options available, including plenty of the prepared meal kits. As he ventures to the frozen and refrigerated section, he reassures viewers: “If you were wondering, yes they do have samples.”
Two dozen organic brown eggs cost $7.69, and, in the dry goods section, the big box of Lucky Charms is on sale for $5.39. Additionally, Legg points out that customers can also purchase alcohol at the Juneau warehouse.
Legg points out the Juneau Costco does have a pharmacy, as well as an optical department and Tire Service Center. Hearing aids are also available there. However, there is no bakery.
The food court also has classics like the infamous Costco hotdog and chicken bake. However, there is no pizza available. “There is no seating inside the food court, but they do have tables outside,” says Legg.
After shopping the entire warehouse, Legg gave his final thoughts:
“I absolutely loved that…it was super simple. It has the vast majority of stuff you want your Costco to have,” he says. He points out that there are only three cities in Alaska with a Costco: Anchorage, Fairbanks, and of course, Juneau.
“I love this concept. I bet not every town could support a full-sized Costco, but I bet a lot of towns could support something this size,” he shares. “I hope Costco starts doing more things like this. Not every Costco has to be the huge, giant, over-the-top warehouse.”
Sure, you could venture to Vegas to experience Phish’s legendary Gamehendge saga in 360 at the Sphere…but it would all pale in comparison to the palpable, electric joy that permeated throughout the audience after an elementary school cast decided to bring it to life.
A small town teacher with a big idea
Every year, music teacher Kirk Kubicek, the leader behind this massive project, tries to give his students in the smaller schools throughout the mountains of Colorado something special for their year-end musical production, despite them not having access to the same resources that other schools in the flatlands might have.
“They have heart, they have courage, and they deserve every bit as much ambition and opportunity as anyone else. Every year I try to give them something bigger, something that asks more of them and leaves them with something they carry forever,” he wrote in an Instagram post.
This year, that meant telling the tale of Colonel Forbin, Icculus, and the Mockingbird, who help the “Lizard” community regain their sacred “Helping Friendly Book” stolen by the greedy King Wilson. With DIY costumes, cardboard sets, a four-person instrumental backing band, and a passionate teacher orchestrating it all, start to finish.
The result was something spectacular and heartwarming, whether you’re a card-carrying Phishhead/Phan or have never heard any of their songs.
“I wanted to recreate what it feels like to be at a Phish show,” Kubicek told Rolling Stone. As you can see in the video above, that mission was certainly accomplished.
Not only did Kubicek and his merry band of kindergarten through 5th graders recreate peak Phish vibes, but they stayed true to the themes presented throughout the album (and arguably through all of Phish’s work), including community, sharing wisdom, and, most importantly, “surrendering to the flow.”
“This elementary adaptation celebrates those same values: that knowledge shared becomes more powerful, that true importance comes from connection rather than control, and that sometimes the bravest thing we can do is remember to have fun and embrace the vibration of life,” the program reads.
Why Gamehendge means so much to fans
For longtime Phish fans, Gamehendge occupies an almost mythical place in the band’s history. The rock opera originated as guitarist Trey Anastasio’s senior thesis project at Goddard College in the late 1980s and became the foundation for some of Phish’s most beloved songs.
Instead of releasing it as a traditional album with widespread radio promotion, Phish allowed the story to evolve through live performances over the years. That helped turn Gamehendge into something fans passed down almost like folklore, with audiences eagerly waiting for rare full performances.
The story itself blends fantasy, humor, and surprisingly heartfelt messages about kindness and knowledge. Which, in hindsight, makes it a pretty perfect fit for an elementary school production.
A wholesome, inspiring memory for all
Part of what makes the video so charming is how fully committed the students are to the material. Nobody appears self-conscious. They sing, dance, act, and throw themselves into the wildly imaginative world with complete sincerity, thanks in no small part to the teacher who gave them the encouragement to do so.
That enthusiasm clearly rubbed off on the crowd as well, many of whom can be heard cheering throughout the performance like proud parents witnessing the world’s sweetest jam band concert.
And then for us online viewers, we got to witness how live music, when performed with passion, still brings people together in the best possible way. Basically, for everyone involved, the production became something much more magical than a simple school activity.
Graciously, the full production of Gamehendge was posted on YouTube and is available for viewing below. Enjoy.
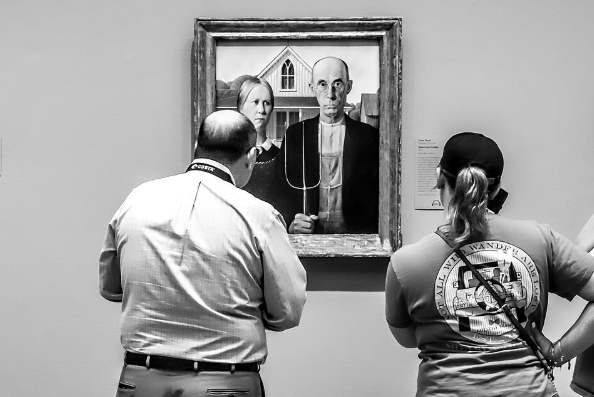
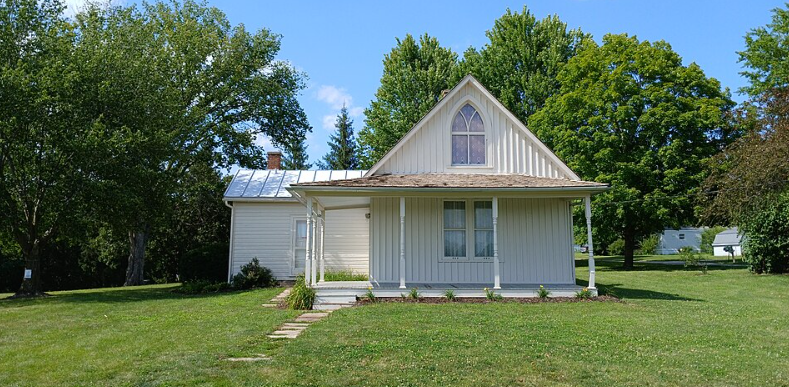
One of the most iconic American images is American Gothic, a 1930 painting by Grant Wood of a farmer holding a pitchfork, standing next to his annoyed daughter (or wife). It’s been parodied everywhere from Homer and Marge standing in the pose on The Simpsons, to advertisements for Nicole Ritchie and Paris Hilton’s reality show, The Simple Life (2003-2007), to Magenta and Riff Raff recreating the painting in The Rocky Horror Picture Show (1975).
To modern eyes, the painting appears to be a traditional depiction of a couple living on the farm. It’s as wholesome as America gets. However, when it was first hung in the Art Institute of Chicago, it was a cultural Rorschach test that offended rural Americans and delighted city slickers. “We should fear Grant Wood. Every artist and every school of artists should be afraid of him, for his devastating satire,” writer Gertrude Stein said of the painting.
Why was American Gothic so controversial?
With American Gothic, context is everything. The painting was released on the precipice of the Great Depression at a time when the Dust Bowl was killing American agriculture. It was also after a great migration when Americans left farms in droves for city life. Rural Americans were mocked for their simpler, conservative ways, with cultural voices such as H.L. Mencken referring to rural Americans as “booboisie.”
The painting showed a dour, joyless couple wearing simple clothing and was painted in a style that could be called medieval—no doubt a comment on their traditional ways. After the painting caught the public’s attention, an Iowa farmer’s wife phoned Wood and didn’t hold back. “She claimed she wished to come over and smash his head for depicting her countrymen as grim Bible-thumpers,” Art History School host Paul Priestley said, according to Open Culture.
The artist’s background also plays a big role in how the painting is interpreted. Wood grew up in Cedar Rapids, Iowa, but often traveled to Europe to study Impressionism. This meant that he had one foot in the world of Bohemian Europe and another as an Iowa farm boy.
Wood would never admit that his painting was anything but an expression of genuine affection for its subjects. Wood “said he painted American Gothic to extol rural American values, real people in their well-ordered world: an image of reassurance during the onset of the Great Depression,” Priestly continues.
American Gothic was born at the beginning of the Great Depression, and its meaning would evolve over the difficult period. By the end of the decade, working people of the Midwest had begun to be seen as noble by city dwellers, who embraced folk music and workers’ rights. Further, mocking the “yokels” who were devastated by a natural disaster felt rather cruel.
The painting’s meaning evolved “because over the course of the thirties in the context of the depression and throughout World War II, it changed from being that satirical image to a national symbol of stability, order, prosperity, virtue and wholesomeness,” Steven Biel, historian and author of American Gothic: A Life of America’s Most Famous Painting, told Pop Entertainment.
Great pieces of art can mean different things to different people and evolve with the times. For many in 2026, American Gothic is seen as simple American iconography and little more than a template for satire. But those who intend to tap into its cultural cache should first understand that it has undergone an incredible cultural arc: it redeemed those it intended to mock while softening the hearts of its jaded first audience. That’s something that the farmer’s wife (or daughter?) probably couldn’t even scoff at.
Peter Bence’s performance of “Africa” by Toto has over 19 million views on YouTube because of his creative reimagining of the song and, well, just about everyone loves “Africa.” Bence is a Hungarian composer and producer who has become a viral sensation for his Michael Jackson, Queen, Sia, and Beatles covers. He has over 1.1 million followers on YouTube and has toured the globe, playing in more than 40 countries across four continents.
His performance of “Africa” is unique because it opens with him creating a rhythm track and looping it by strategically tapping the piano and rubbing its strings to create the sound of shakers and conga drums.
The video eventually becomes rapturous, with Bence making the piano sound like an entire orchestra.
The comments say it all
As the video caption says, “Toto x Peter Bence = Africa Piano Symphony.” Indeed. People were blown away by Bence’s impressive rendition of the classic 80s song.
“I’m so glad to watch and see a fellow musician, that enjoys the music deep down. Excellent playing man!”
“So fluid. The piano is an extension of your whole body. Amazing.”
“I don’t think I’ve ever seen anyone has so much fun playing the piano. You’re not just terrifically talented, I love the creativity.”
“Brilliant! Loved it. It made me think what would J S Bach have done with looping on a piano/harpsichord?”
“Mesmerizing! He became the music and the music became him.”
“Are you kidding me!!!! This cover is incredible. Still listening to it, years after I discovered it.”
“I return to this regularly, it’s absolute witchcraft levels of genius. This level of talent isn’t written in any handbook, it’s completely unworldly.”
“I love how PB plays a piano worth more than my house in his bare feet like it’s an actual extension of his body. Pure brilliance.”
Peter Bence was considered a musical prodigy as a child. Photo credit: Canva
He has been a prodigy since toddlerhood
If it seems like Bence was born to do this, that appears to be accurate. According to the bio on his website:
“Starting as early as age 2 he already played back melodies by ear from his favorite cartoons and films on his grandparents’ upright piano. Showing serious interest and talent, he soon began his musical education at 4 in the local music school of his hometown, Hajduboszormeny in Hungary.
He was considered a musical prodigy by teachers and peers, and was already accepted at Franz Liszt University of Music in Debrecen, despite he was still being enrolled at elementary school.
At 7 he wrote his first composition, which was heavily influenced by the music of Mozart and Chopin, and at 11 he published his first solo piano album of his early compositions.”
So yeah. The guy has had piano chops since toddlerhood, and he’s made the instrument his own with unique, edgy pieces like this one.
And about the song itself
Released in 1982 and peaking at number one in the U.S. in February 1983 and number three in the UK, “Africa” was Toto’s biggest hit, and the top 10 globally. It’s a stirring piece of music that’s beautifully arranged with an anthemic chorus. However, the lyrics aren’t that accurate.
The song’s author, Toto drummer Jeff Porcaro, describes it as: “A white boy is trying to write a song on Africa, but since he’s never been there, he can only tell what he’s seen on TV or remembers in the past.”
Nevertheless, the song is an iconic tune that captures a specific spirit of the early ‘80s when the world turned its focus to Africa. Over 40 years later, the song’s wholesome sincerity has made it a piece of music that every few years captures the hearts of a new generation.
Back in April 2021, then-17-year-old Weronika Jachimowicz got a lot of attention for subverting people’s expectations of who excels in high school—and that’s exactly what she wanted. Jachimowicz was named New York’s Mattituck-Cutchogue Union Free School District’s 2021 salutatorian. Her yearbook photo next to valedictorian Luke Altman is going viral because of her dramatic Goth makeup and attire.
It all started when assistant professor and writer Dr. Jules Lipoff’s tweet of the photo of the valedictorian and salutatorian he saw in a newspaper went viral. How many salutatorians have you seen wearing pentagram hoop earrings, a choker, and black devil horns? The juxtaposition of her next to the bowtie-wearing Altman makes the photo even more amusing.
The Today Show reports that Jachimowicz at first took her senior photo dressed “normal.” During the retake, she decided to “go all out and be herself.”
Jachimowicz wanted the world to know that there’s no one way someone has to look or present themselves if they want to be academically successful, or successful in any right.
What research actually says about Goth kids
In fact, it’s completely normal for kids who are interested in the Goth subculture, as well as any other clique or community, to be good students.
“The scene has quiet middle-class values—education, highbrow culture, theatre, museums, romantic literature, poetry, philosophy, Gothic architecture,” Dr. Dunja Bril, who studies Goth culture in England, told The Independent in 2006.
“Many Goths like classical music. It’s a status symbol to have a good collection of classical pieces—mostly requiems and darker pieces,” she added.
“Going to do a university degree is encouraged,” Bril continued. “[Being Goth] doesn’t encourage people to drop out of school. Whereas in the Punk scene you turn down the normal educational values, in Goth you gain status if you’re perceived as being educated. You get people who are in it for the shock value, but they are usually the ones who grow out of it.”
Another study found that joining the Goth subculture may be good for young people’s mental health, offering them protection in the form of strong peer support and community. “Rather than posing a risk, it’s also possible that by belonging to the goth subculture, young people are gaining valuable social and emotional support from their peers,” writes New Scientist, quoting the study’s author.
“In all honesty, that’s all I wanted. I wanted to help anyone I could who is struggling with expressing themselves because I’ve been in the exact same position,” Jachimowicz told Yahoo! Life. “When people message me telling me how I have given them the confidence to be who they truly are, I almost cry from happiness.”
Jachimowicz says that she was able to be herself because she was encouraged by others, so this is her chance to pay it forward.
“I was always trying to please others and be like what everyone else wanted me to be, or at least try to fit into what was ‘normal.’ However, I did slowly start to realize that it’s OK to be different,” she said. “I’ve met people in my life who gave me the confidence to fully be myself,” she added.
By the way, her resume is incredible
In addition to having an unweighted GPA of 97.27%, Jachimowicz was on the fencing, ping pong, and winter track teams. She was also a member of the National Honor Society, Students Against Drunk Driving, and the Unity Club. The Suffolk Times says Jachimowicz had some of her hand-drawn art chosen to appear on the cover of the senior yearbook, as well.
She told Fox 5 New York in a 2021 interview that she planned to major in biology and forensics after graduation, with hopes of becoming a forensic pathologist.
Jachimowicz’s accomplishments are another reason to never judge someone for how they look or their interests. Just because someone is wearing satanic earrings doesn’t mean they aren’t highly intelligent or athletic.
She believes the most important thing is to be yourself, regardless of what anyone else thinks. “Even if others don’t really like my style, it’s what makes me happy and I’ve worked hard to finally come to that conclusion,” she said.
This article originally appeared five years ago. It has been updated.
Bob Dylan sang that the times are a-changin’ back in 1964, and since then, they haven’t ever stopped a-changin’. And yes, change has been a constant for all of humanity’s existence, but things certainly seem to be progressing a whole heck of a lot faster, don’t they?
Before ya know it, those once fashion-forward pants you purchased are now retro, you don’t understand any of the slang the kids are spouting, and you’re doing your taxes, grocery planning and work meetings all from your phone. You know, that device that once only…gasp…called people.
It certainly feels like more than simply growing older, too. Technology is evolving at a rapid pace, to the point where human beings are finally having a hard time keeping up. Combine that with uncertain economic times, and it’s no wonder that some folks are left reminiscing about how, in some (not all or even most, but some) ways, the good old days really were good.
Thousands of people chimed in with fascinating bits of bittersweet nostalgia. Some were monetary — just think that the price of most everyday items has increased 2-3x since the 90s. Other memories were more intangible, based on experiences you just don’t get very often anymore.
The things people miss most might surprise you
Here are some of the best answers.
1. “New furniture made out of real wood.”
If you regularly traffic in furniture from Target, IKEA, Wayfair, and other relatively affordable places like that, you’ll recognize that furniture these days is more often than not made from particle board or fiber board, not real wood. That makes it convenient and relatively cheap, but not very durable.
3. “Paying no more than 30% of your income in rent.”
One user added: “I lived in poverty housing and this was how they determined our rent. It was 30% of mom’s income, regardless of how much she was making. That was 20 years ago, not sure what starving kids do today.“
One person added: “17 years ago I spent $30 to see an internationally touring band play a concert, and I thought that was way too high. Now I’m spending minimum $20 to see local bands. Just on admission.”
5. “Household products that don’t break within the first few years of use.”
One user wrote: “My grandma had the same fridge from 1993 before deciding to switch to a newer, bigger one two years ago. My mom’s wedding cookware is still going strong 25 years later, but whenever she needs new pans, they start flaking Teflon into the food within a few months.”
Today, modern refrigerators are only expected to last about 10 years and generally aren’t worth repairing.
6. “Not being expected to be reachable 24/7.”
Ah, yes, being completely unreachable was the ultimate luxury. Most of us have actually forgotten what it feels like.
7. “Being able to afford going out every Friday after work.”
Remember happy hour specials? Dollar beer nights? It was easy to go out with friends or colleagues when a single beer didn’t cost $11 with tip.
8. “Farmer’s markets.”
“You used to be able to go down and get fruit and vegetables cheaper than the grocery store. Now it seems like they charge 3x more than stores do,” one user noted.
9. “Single income families buying a home.”
Another user read everyone’s mind by adding: “Buying a home in general”
“I have clothes from the 90s (and 80s from my mother) that still hold up today. These days, I’m lucky if my shirt isn’t saggy and misshapen within a year,” one user wrote.
You’re not crazy. Flying used to be more comfortable. Planes have given up about 1-2 inches of legroom over the years, making passengers cramped and grumpy.
The days when legroom was free. Photo credit: Canva
13. “Free driver’s education classes taught in all high schools.”
Private driver’s ed can cost anywhere from $500-1000 where it used to be much more commonly provided for free. Shouldn’t giving the next generation of drivers thorough safety training be considered a public necessity?
14 . “Family vacations.”
“I remember going on road trips regularly as a kid and even flying once or twice. Now that I have kids, I cannot afford a weeklong trip to the Badlands, Grand Canyon, Disney/Universal Studios, etc. The best I can do is a day trip to the Wisconsin Dells maybe once a year,” one user wrote.
15. “Apartments.”
“I could get a one-bedroom apartment in Wisconsin back in 1997 for under $500. Now that same apartment is at least $2,000.”
Apartments are supposed to be the affordable thing! What happened?!
16. “Affordable healthcare.”
Even “good” healthcare these days leaves you paying enormous of out-of-pocket expenses. I’m not sure healthcare in America was ever great, but it’s definitely gotten worse.
17. “People making friends with one another purely because they enjoy their companionship and not because of networking.”
Hustle culture has really changed the way we think about friends and leisure time.
18. “Calling a company and getting a person on the other end of the phone.
Another problem that’s only getting worse with AI! They even have AI instead of people working at drive-thrus now.
19. “Drinking water from the tap without filters and softeners.”
More and more people are using home water filters for taste and, more importantly, because they don’t trust the local drinking water. Gee, wonder why?
20.”Being able to dance and have a good time without having the risk that it will end up being recorded and put on social media.”
Every time you leave your house you’re at risk of being pranked for TikTok or ending up in one of those life-ruining drunk “street interviews.”
So what does all of this actually mean?
The 90s and 2000s were a simpler time. Not everything was better, or even great, but there was something real about it. People were more authentic, things we bought weren’t so cheaply made yet expensive, and your hard-earned dollar went a lot further than it did today. We can’t go back, but it’s sure nice to visit every now and then.
This article originally appeared three years ago. It has been updated.
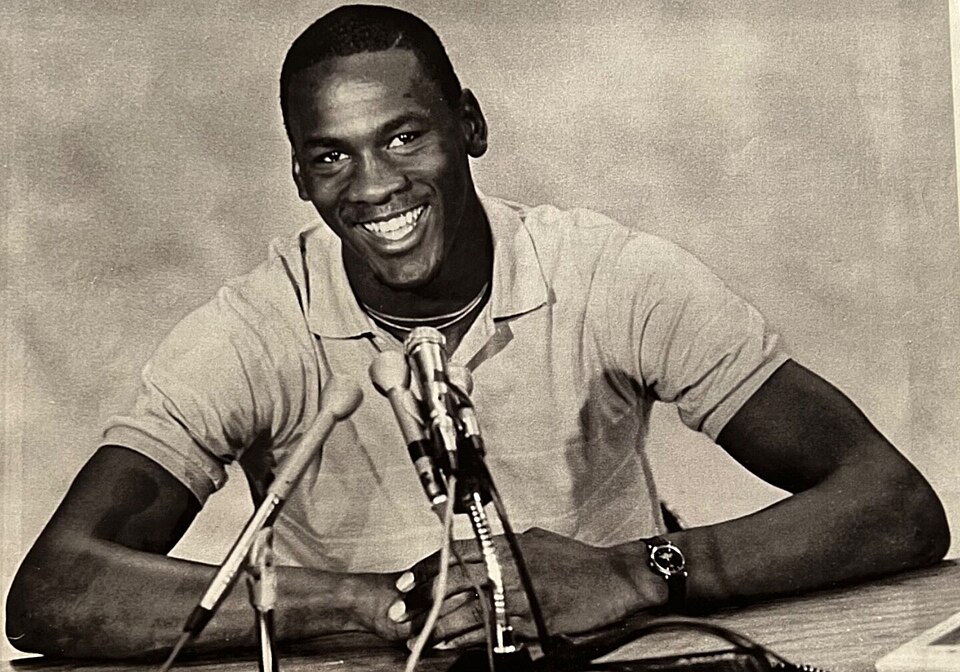
NBA legend Michael Jordan is known as one of the most ruthless competitors ever to step foot on a basketball court. But he also understands that success isn’t everything, and that it all works toward fulfilling a greater life purpose. “To be successful, you have to be selfish, or else you never achieve. And once you reach your highest level, you have to be unselfish. Stay reachable. Stay in touch,” he once said.
Jordan recently showed that he has never forgotten where he came from by reconnecting with Ms. Etta, the transportation coordinator at Emsley A. Laney High School where he graduated 45 years ago. Ms. Etta was a hospice patient at Lower Cape Fear LifeCare in Jordan’s hometown. In her final days, she couldn’t stop talking about Jordan, who was one of her favorite students. Her biggest wish was to hug him one last time.
Jordan reaches out to a beloved high school teacher in her final days
Administrators at LifeCare tried to reach out to Jordan, but they never heard back. Then, on May 12th while at home, Wendy, a LifeCare social worker, received a call from an unknown number. It was Jordan: “Is this Ms. Etta?” he asked. Wendy then drove over to Ms. Etta’s bedside, and they set up a video call with Jordan.
“They laughed, reminisced, picked at each other, and shared a moment that brought tears to everyone in the room,” LifeCare wrote in the caption of an Instagram post showing Ms. Etta and Jordan smiling and talking together. “A memory her family will carry with them forever.”
High school plays a big role in Jordan’s legend. He graduated from the school in 1981, but as a sophomore in 1979, Jordan was “cut” from the varsity basketball team. Jordan has always said this was the catalyst for his becoming one of the greatest pro athletes the world has ever seen. However, at that time, sophomores rarely played on varsity teams. Jordan was sent to Junior Varsity because the team needed taller players.
Jordan has clearly gotten over the slight, and, in 2019, he donated $1.1 million to Laney as part of an agreed-upon deal between Jordan, the school, and Nike for the 2013 sales of Jordan’s special Laney 5 sneakers.
“Mike decided that he wanted to take care of Laney High School,” Laney Athletic Director Fred Lynch said, according toWECT. “With him and his attorneys wanting to make sure that it would go entirely to Laney High School. So, Mike is still the man.” Half of the money went to the athletic department, while the other half was used at the school’s discretion. “It’s a very good thing. It’s a blessing to give that much money to a school,” Laney student Dariius Dutton said. “It means a lot to me because I love Laney, I love my school. And I think it will help a lot.”
One can have all the success in the world, but without gratitude, it’s as empty as never having achieved anything in the first place. For Jordan to reach out to someone who helped him as a child in their final days shows that, although he may have reached incredible heights as an athlete, he never forgot those who helped him get off the ground.
Picture this: A city neighborhood has exploded in population, from a few hundred people to more than 3,000 residents in just a few years. With a new $450 million soccer stadium being built nearby, experts expect that population to rise to more than 9,000.
And yet, there are glaring gaps in the community. With no neighborhood school, library, or community center, people have few local public spaces to gather. And with a stark lack of grocery stores and restaurants, residents have found themselves living in a “food desert.”
Artist’s rendering of the front of Alchemist Public Market. Photo courtesy of Alchemist CDC
A vibrant public space that serves as an incubator for new food businesses
The first-of-its-kind public market will include a corner store that accepts WIC and CalFresh (California’s SNAP benefits program) and sells grocery staples and products from local makers. People will be able to connect at the market’s eating areas, co-working space, inclusive playground, and weekly farmers market.
But APM will also provide opportunities for up-and-coming food entrepreneurs. The space will be home to eight small incubator restaurants in a shared food court, as well as a shared-use commissary kitchen that can support dozens of independent food vendors.
Shannin Stein, Alchemist’s director of advancement, tells Upworthy that one goal of the market is to make sure people living and working in the neighborhood aren’t left out of the economic conversation as hundreds of millions of dollars are invested in the surrounding area. That goal aligns with Alchemist CDC’s long-time support of food entrepreneurs from underserved populations.
Helping food entrepreneurs get their businesses off the ground
Alchemist CDC has multiple programs that help support burgeoning food businesses, and APM will serve as an extension of that support.
Nikki Gaddis-Chester, owner of Jerk Street Tacos, has been part of the Alchemist Kitchen Incubator Program (AKIP) for the past two years and looks forward to having a space at APM. She tells Upworthy that mentorship from Alchemist has “significantly transformed” her business journey.
“This vibrant community has not only supported the growth of our small mobile food business, but has also equipped us with essential tools for developing and sustaining our menu,” she said.
Jessica Brown, founder of Latin Caribbean culinary brand Caribe Azul, tells Upworthy that APM will be “a powerful opportunity for entrepreneurs who have the creativity, culinary experience, and drive to start a business but may not yet have the structure, knowledge, or support to build a strong foundation.”
“I came into the program with a clear concept for my Latin Caribbean cuisine, but building a business can feel isolating when you are managing so many parts on your own, from operations to marketing and promotion,” she said. “What I experienced through Alchemist felt like opening a gate to a portal I did not realize I had access to, but that was always there. It helped me recognize the strengths I already had while giving me the structure to apply them with confidence.”
An all-electric campus that fosters community around food
The APM project aims to connect people to local agriculture and food businesses while also meeting the goal of environmental sustainability.
“APM is being built as a state-of-the-art, all-electric, sustainably designed campus that reflects Sacramento’s leadership in environmental innovation, investment in local food systems, and community-centered economic development,” Stein said. “We want this to be a place where neighborhood residents, visitors to Sacramento, and anyone who loves food and community feel welcome and connected.”
So-called “third places,” where people can meet up outside of home or work, play an important role in building community culture. Sam Greenlee, CEO of Alchemist, describes how local residents will be able to use the space:
“Alchemist Public Market will serve as a heart for this emerging community. At APM, people can walk over to buy their grocery staples, and that includes people who depend on EBT and WIC nutrition benefits. Community elders can read the paper and chat over a great cup of coffee. Parents of young kids can meet up to enjoy delicious food while their kids have fun in the play area. Co-workers can go out to lunch and find enough variety to make everyone happy. Teens can come by after school, get a snack, and check out ping pong paddles or a basketball to play in the park next door. Families can meet their neighbors at the weekly farmers’ market, listen to local musicians during dinner, and celebrate after Sacramento Republic FC matches.”
A community gathering space that serves as an engine of economic growth
Alchemist Public Market broke ground in April 2026 with bipartisan support and significant public funding secured. Sacramento Mayor Kevin McCarty and Congresswoman Doris Matsui attended the groundbreaking.
“Alchemist Public Market will drive economic growth, support public health, and transform a vacant space into a community center, increasing food access for the immediate neighborhood and fostering economic growth that will ripple across Sacramento,” McCarty told Upworthy. “We were proud to support Alchemist CDC’s Farmers’ Market access program and look forward to this all-electric market.”
Greenlee concurs on the importance of the market as a driver of the local economy. “APM is going to be an economic development engine at the heart of our region for decades to come,” he said, “launching new businesses that represent the diversity of our communities, filling vacant storefronts, hiring neighbors, paying local taxes, and altogether making Sacramento a more vibrant place to live.”
The challenges of nonprofit projects in tough economic times
Of course, like most nonprofit organizations, Alchemist has had to play whack-a-mole with challenges since the market’s inception. The economic woes we’ve all experienced in recent years have taken a toll on the project and its organizers as they navigate the ever-evolving world of government funding, manage cash flow timing, and deal with dramatic increases in building material costs.
“Community-based organizations are often expected to solve deeply complex social and economic challenges, but without the same incentives, flexibility, or financial backing commonly available to traditional for-profit development projects,” Stein said. “It can create a difficult dynamic where nonprofits are asked to prove success long before receiving the level of investment needed to fully realize that success.”
Though construction has already begun, the project faces an immediate need for a bridge loan to move forward as red tape ties up funding disbursements. However, Alchemist is determined to bring the market and all it has to offer to life.
“This project’s existence is the story of numerous almost-insurmountable challenges, and the tenacity to find a way through each one,” Greenlee said. “Early on, many people understandably thought the project was a bit pie in the sky; a great idea that seemed unlikely to become reality. As a non-profit, we have always faced challenges funding the next step of the project…But at every step in the process, we have demonstrated our commitment to see this project through, and we have found people stepping up to help us through each and every obstacle.”
You can find updates on Alchemist Public Market here and learn more about what Alchemist CDC does here.


